Now your LLM can generate
bar charts

Your chat client can generate rich, interactive UIs in your browser.

Try it
Line chart visualization
OHLC chart visualization
Pie chart visualization
Sankey chart visualization

An MCP Server for Interactive User Interfaces

Any MCP-aware AI chat client can generate UIs that open in your browser.

Flexible

  • Rich, interactive UIs of all kinds.
  • No apps to install - just configure your AI chat client.
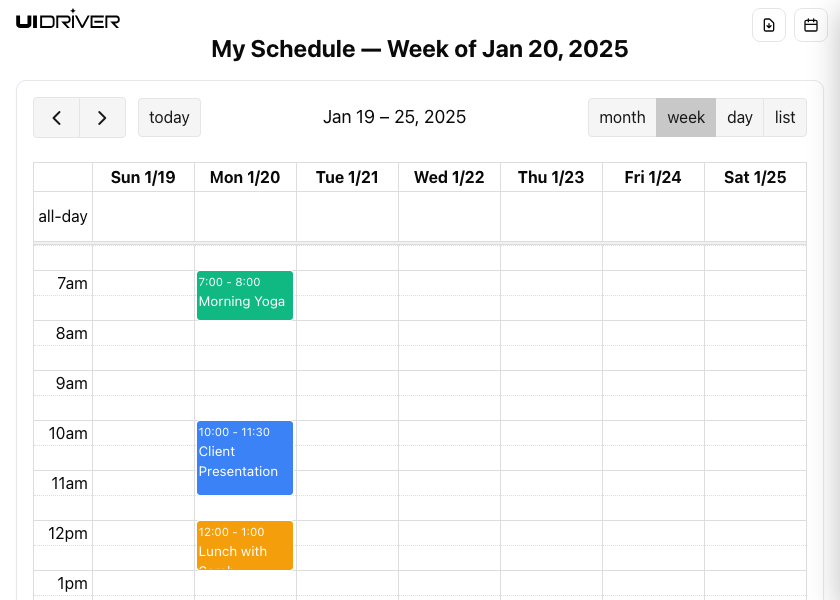
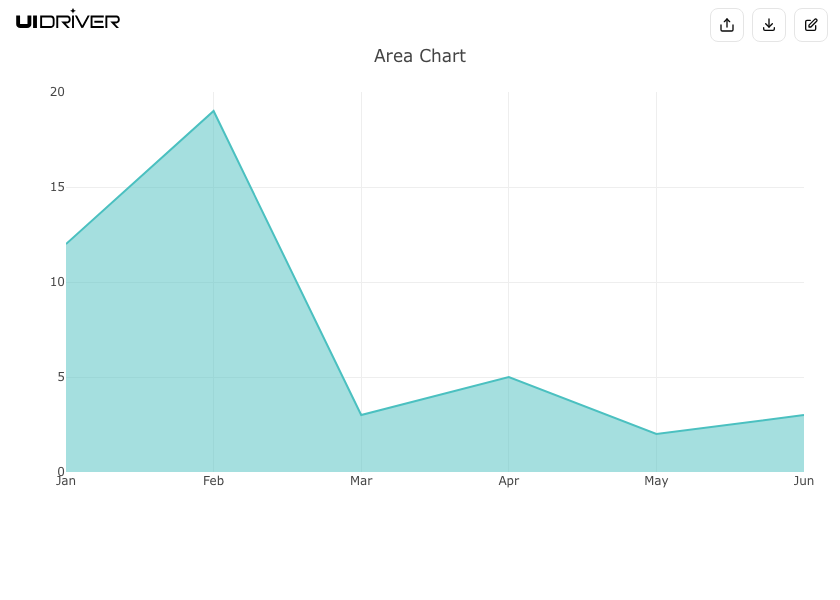
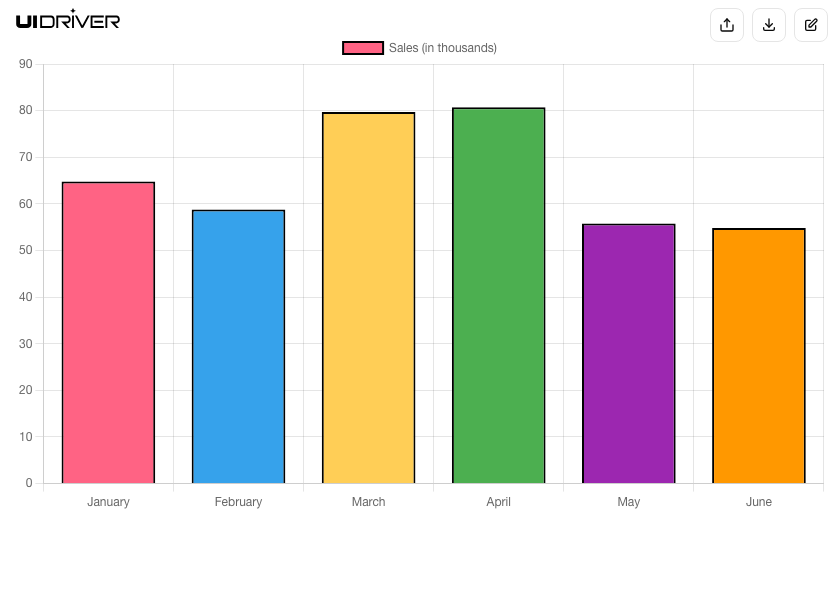
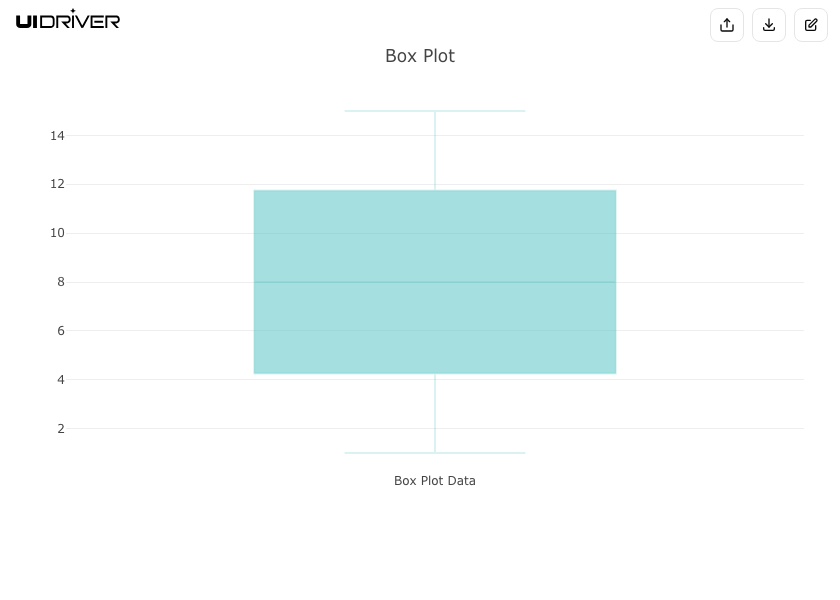
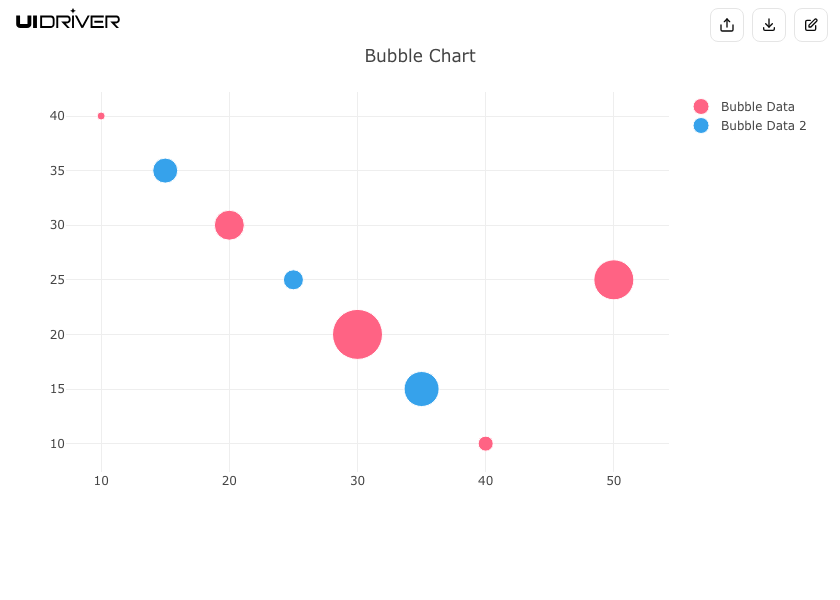
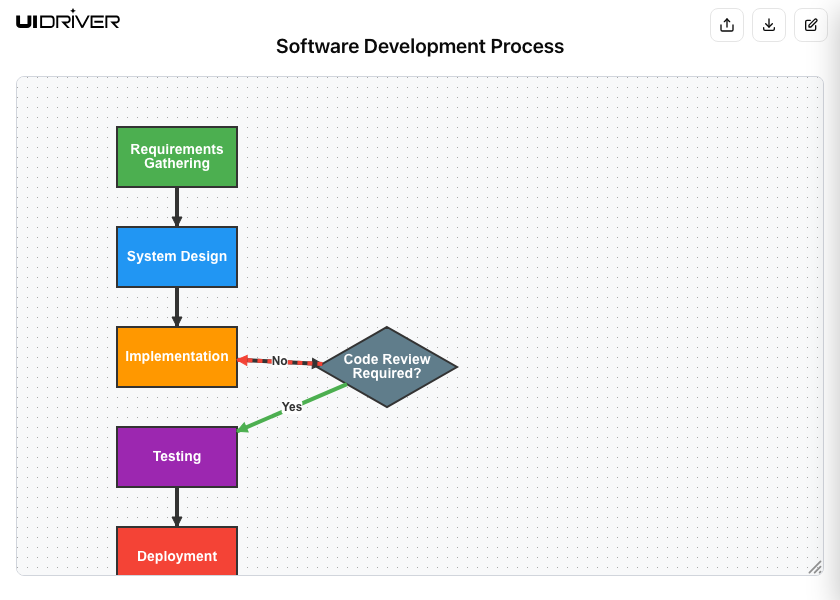
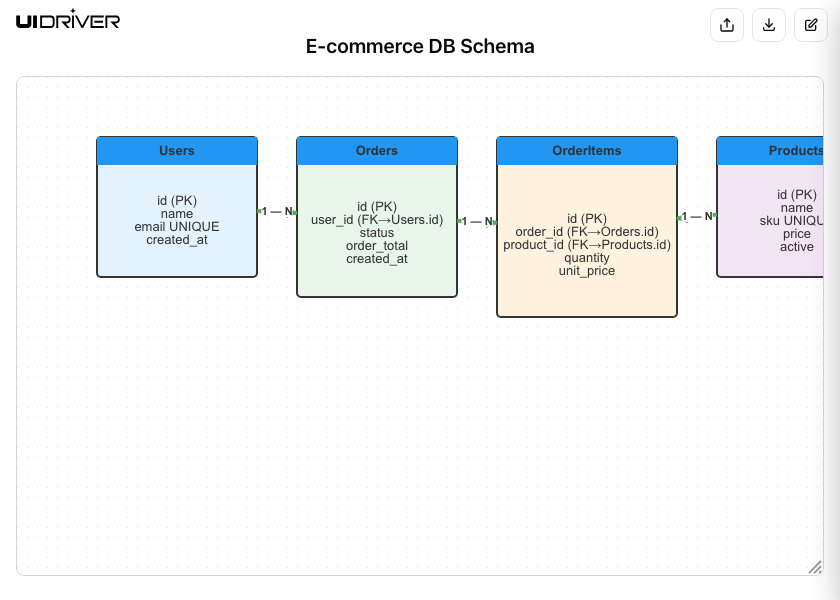
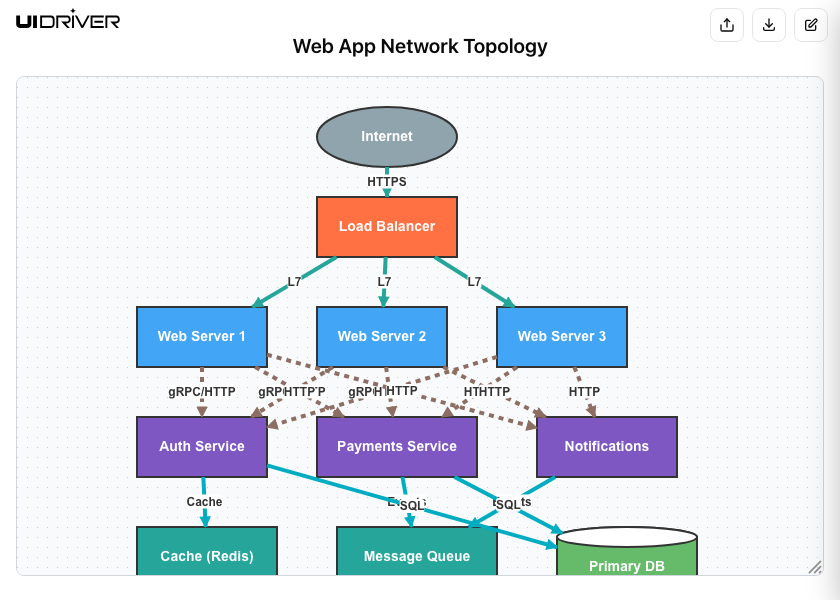
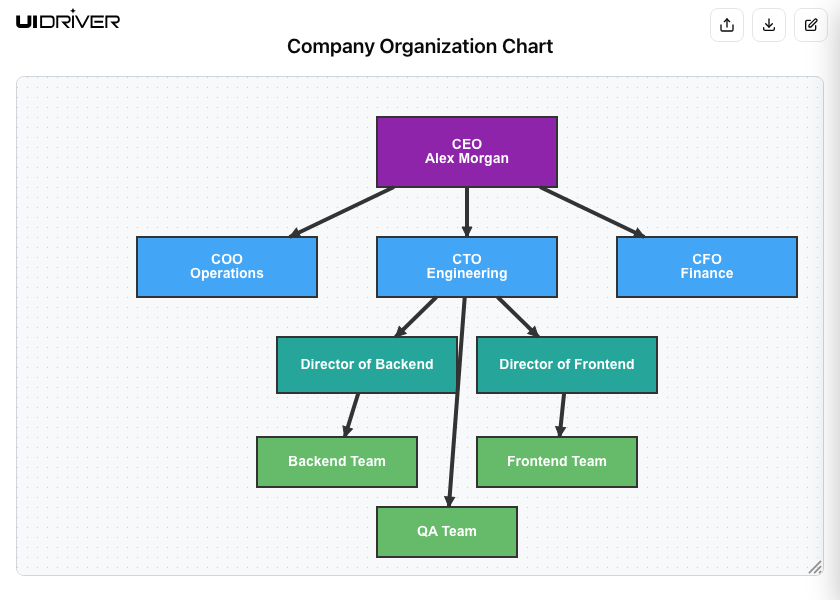
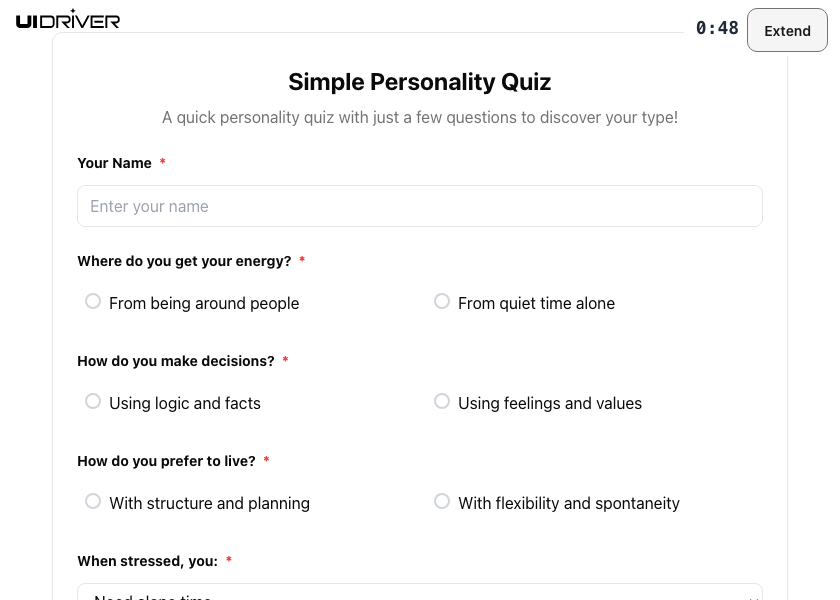
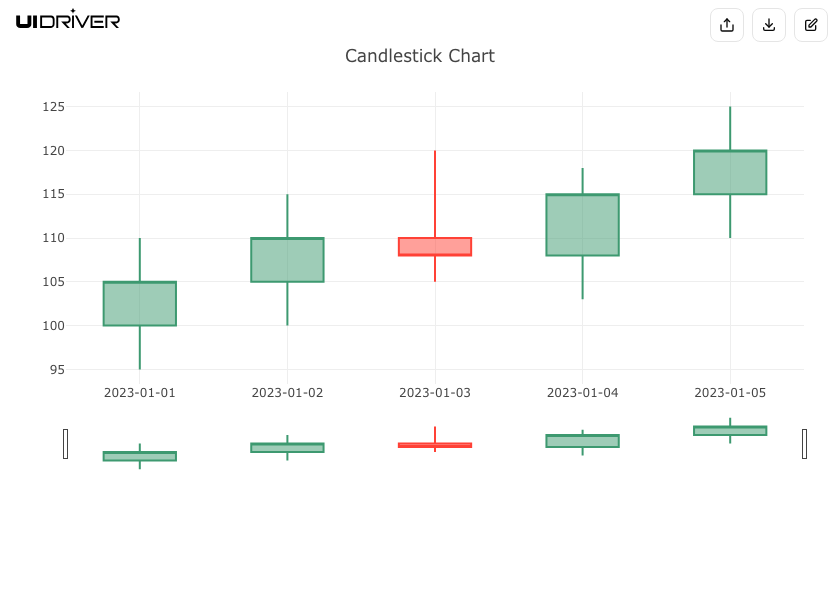
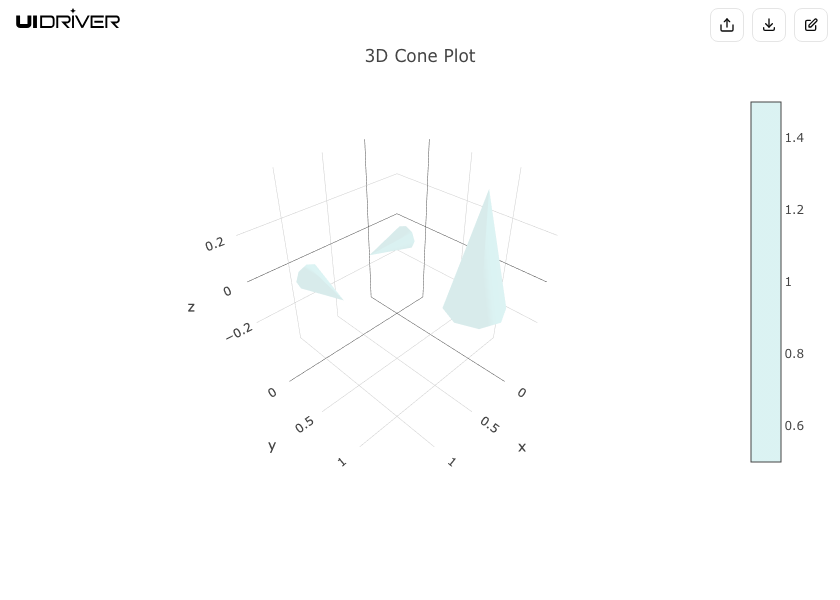
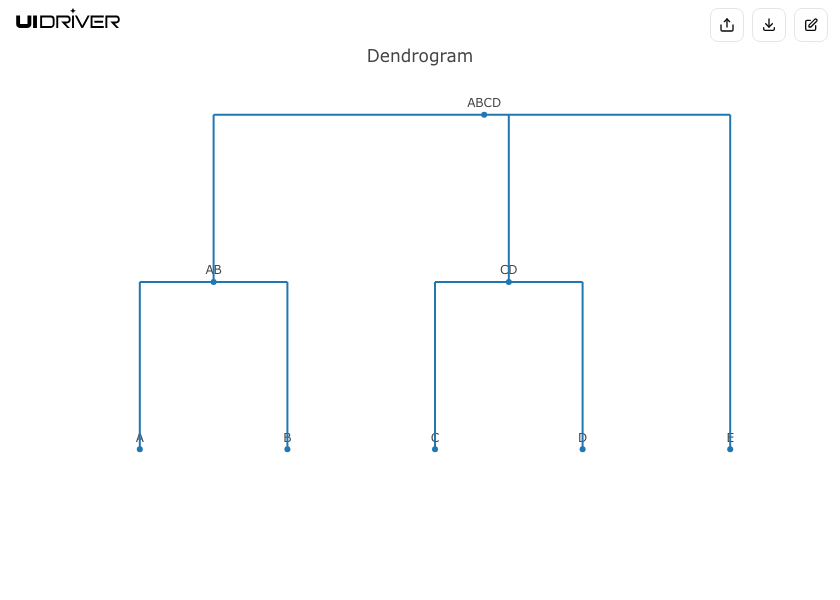
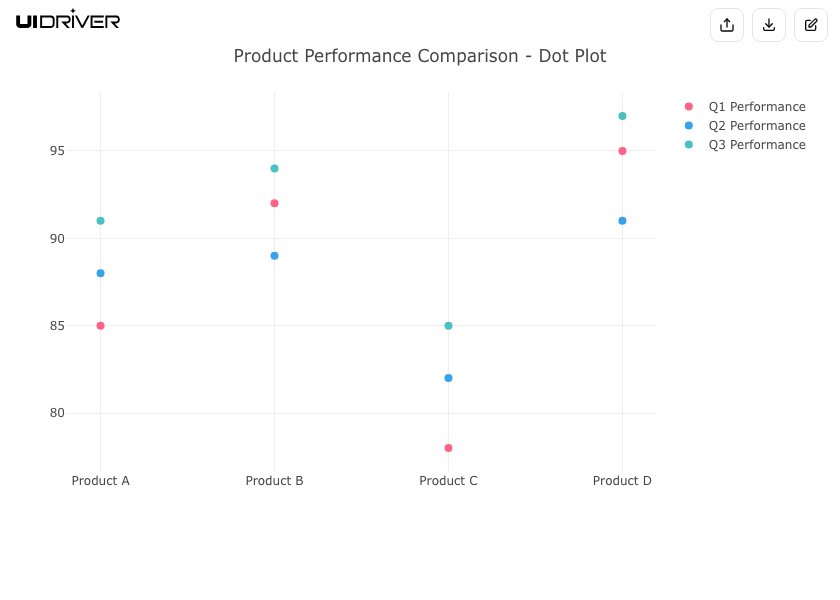
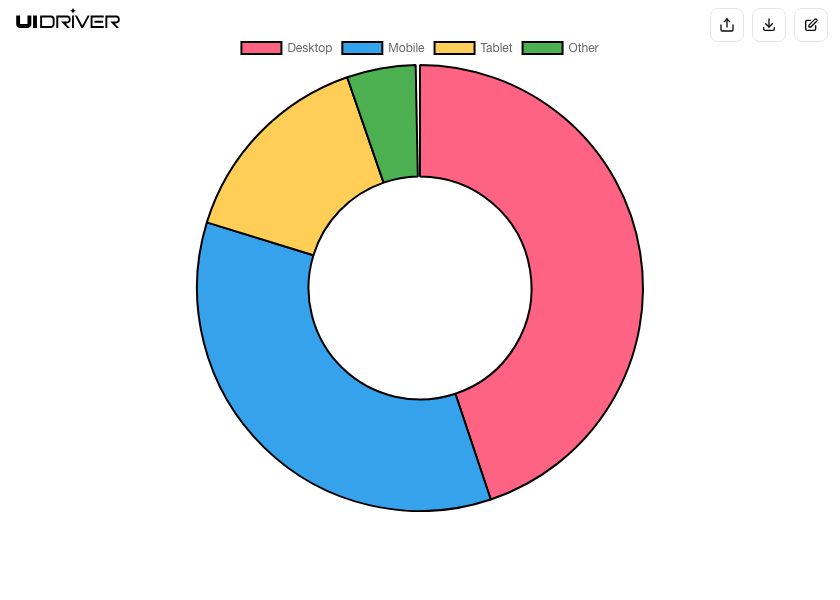
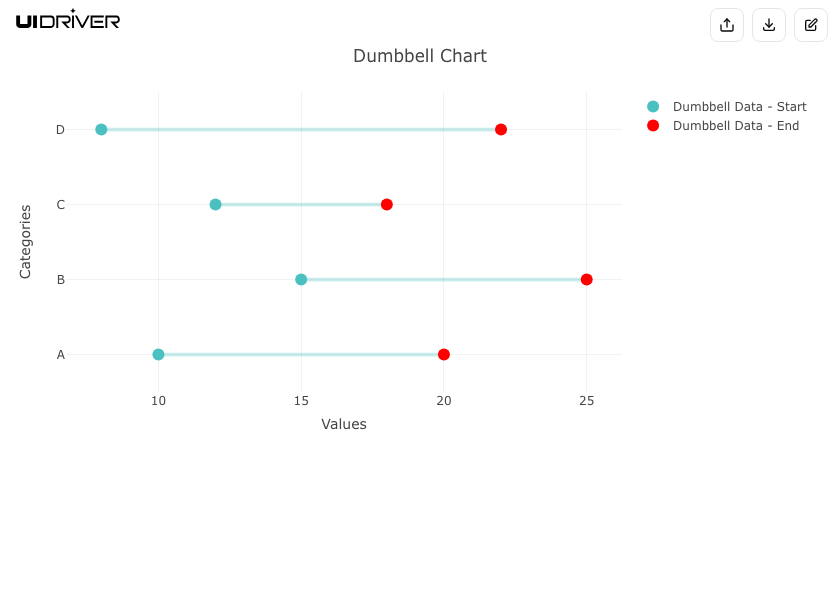
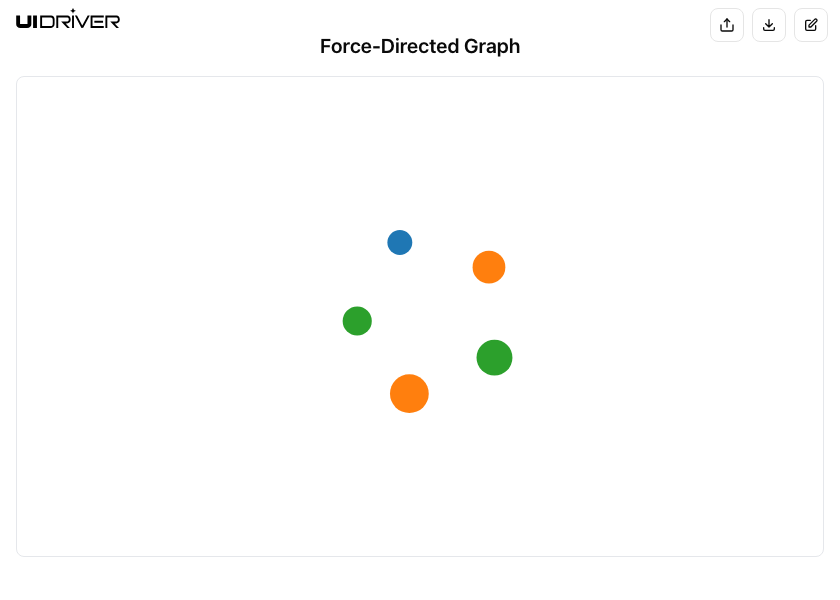
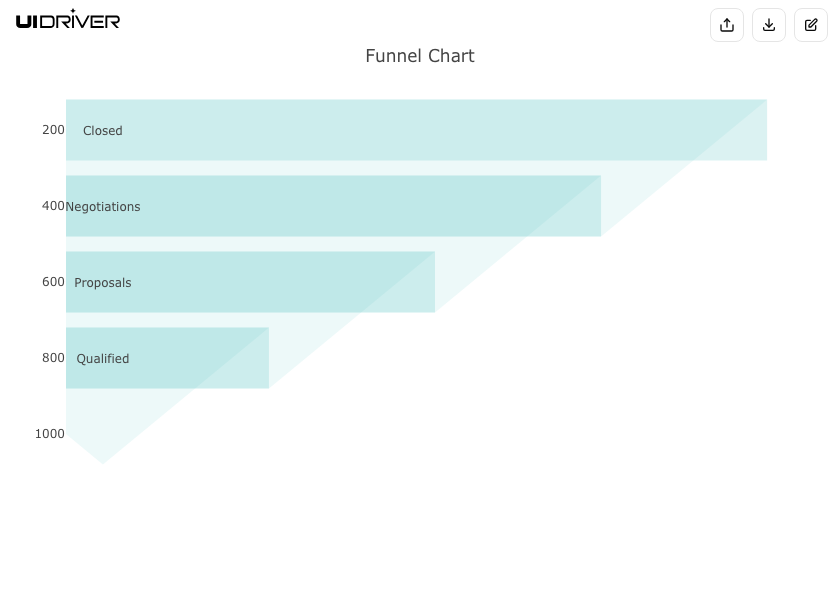
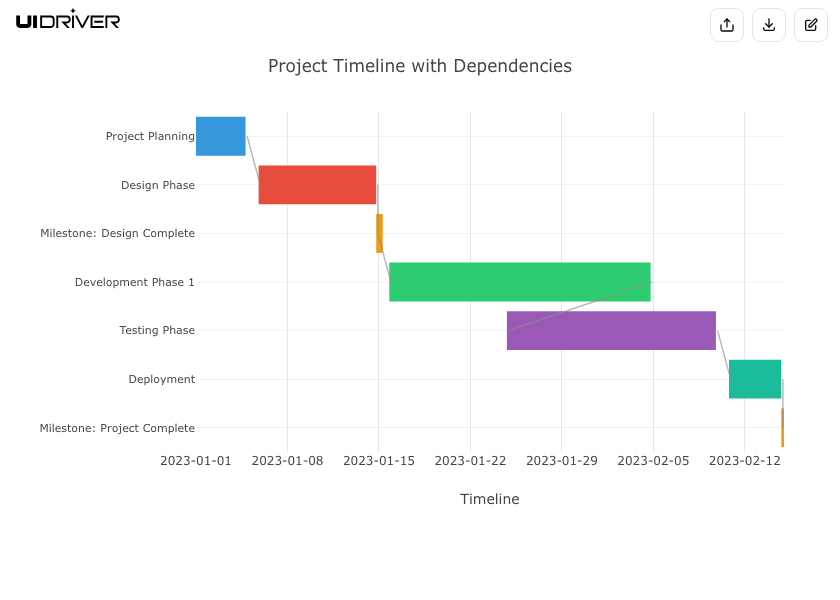
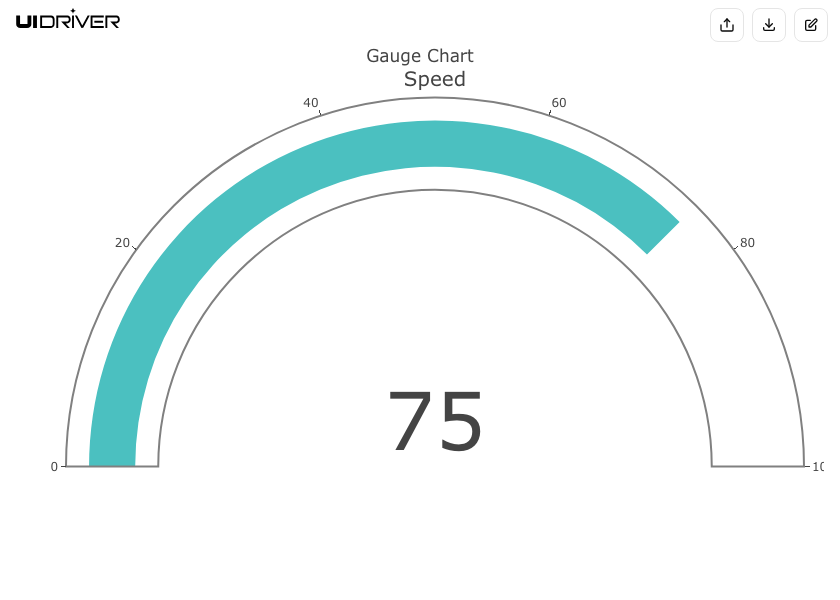
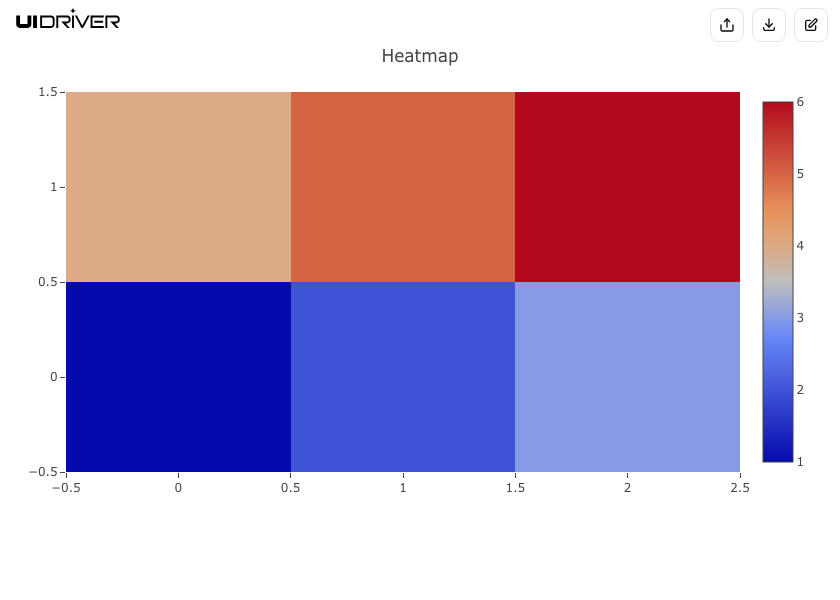
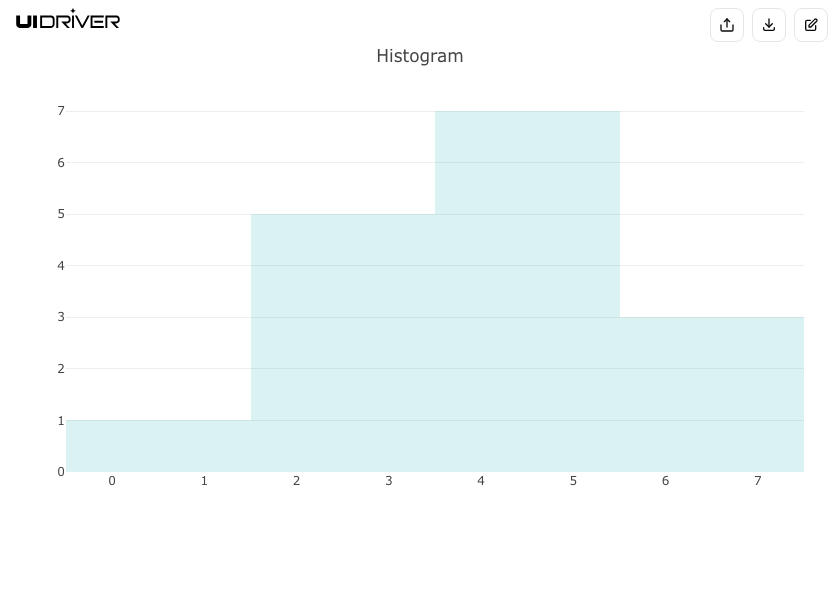
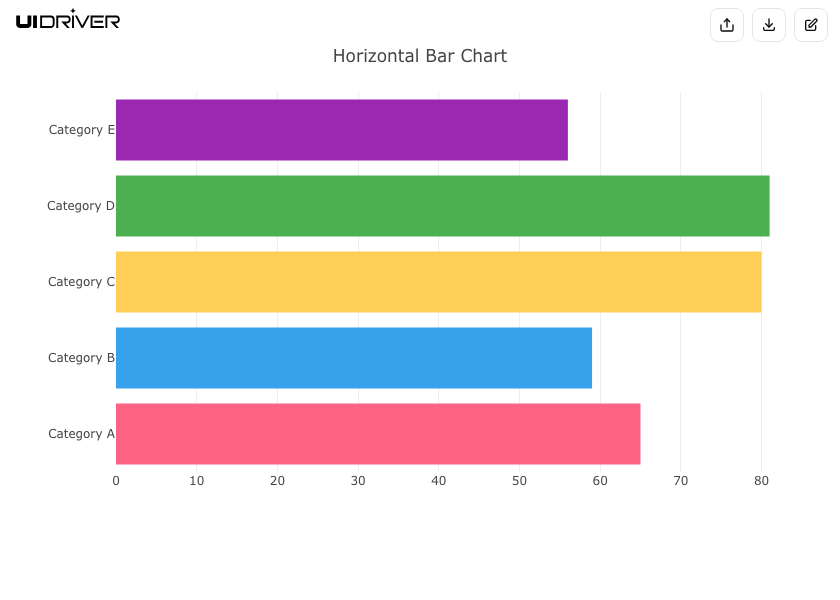
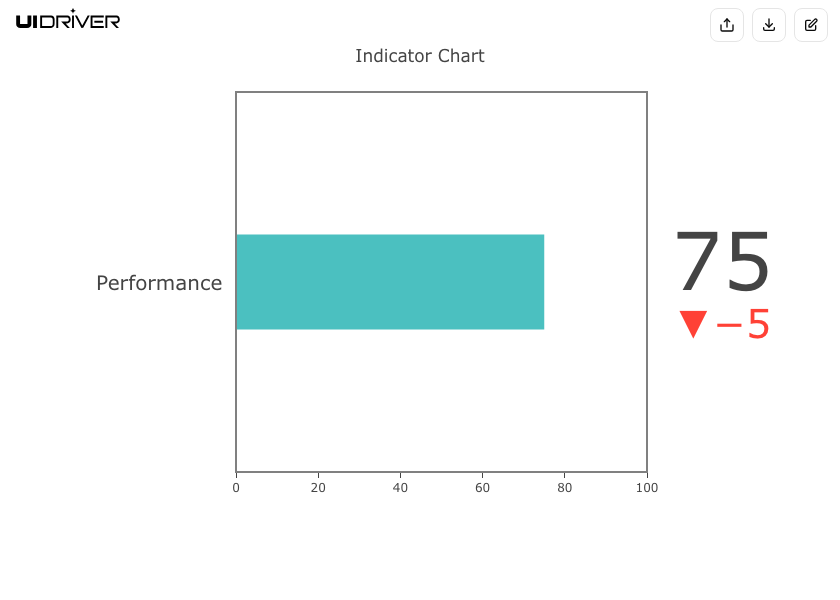
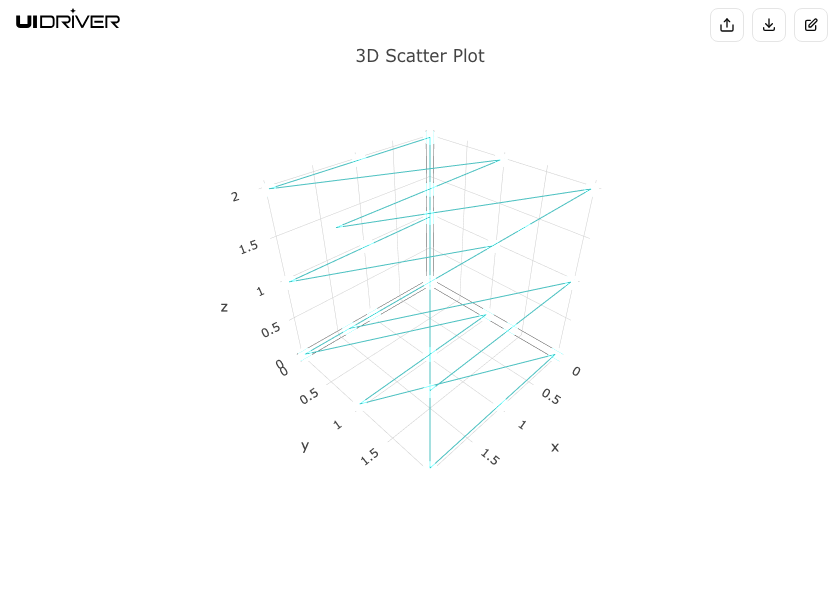
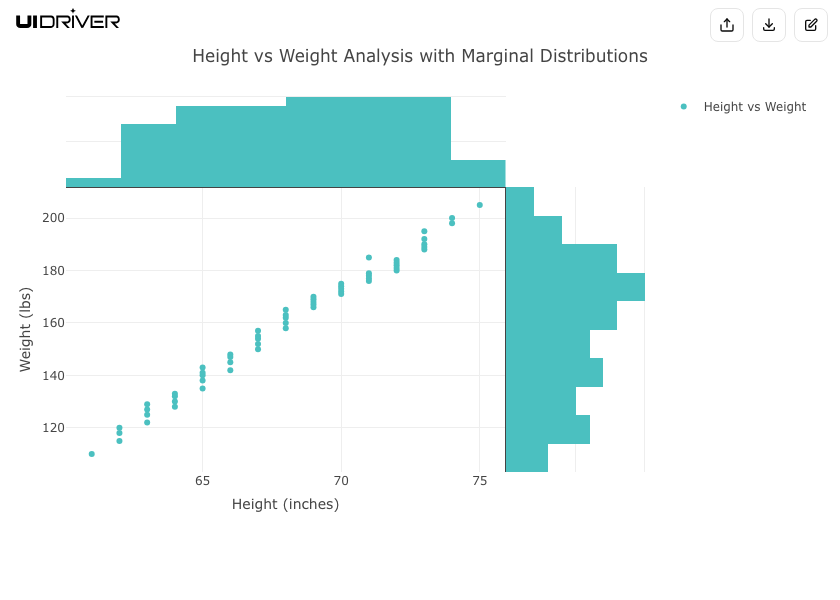
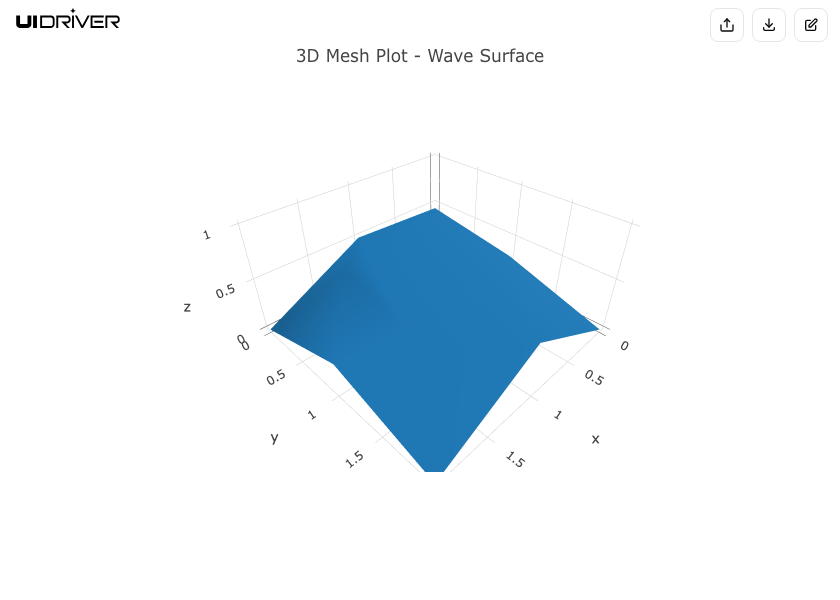
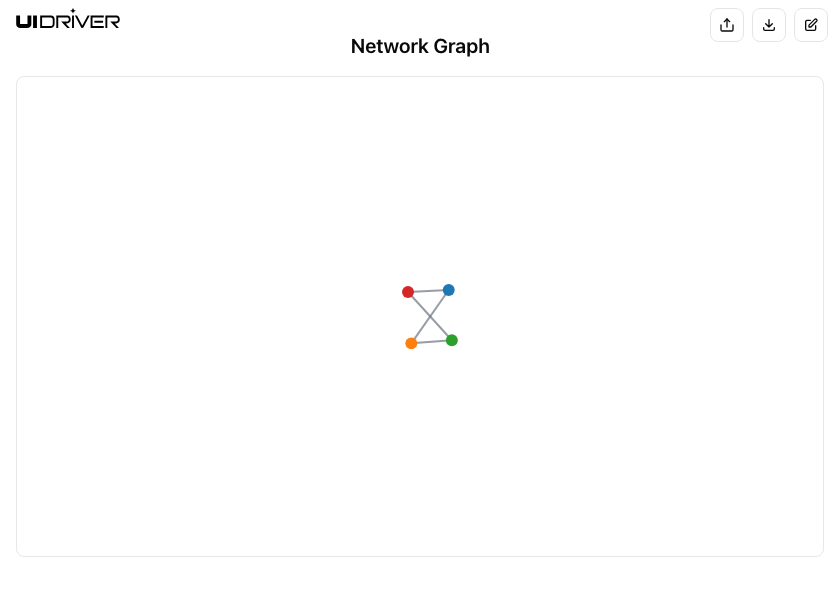
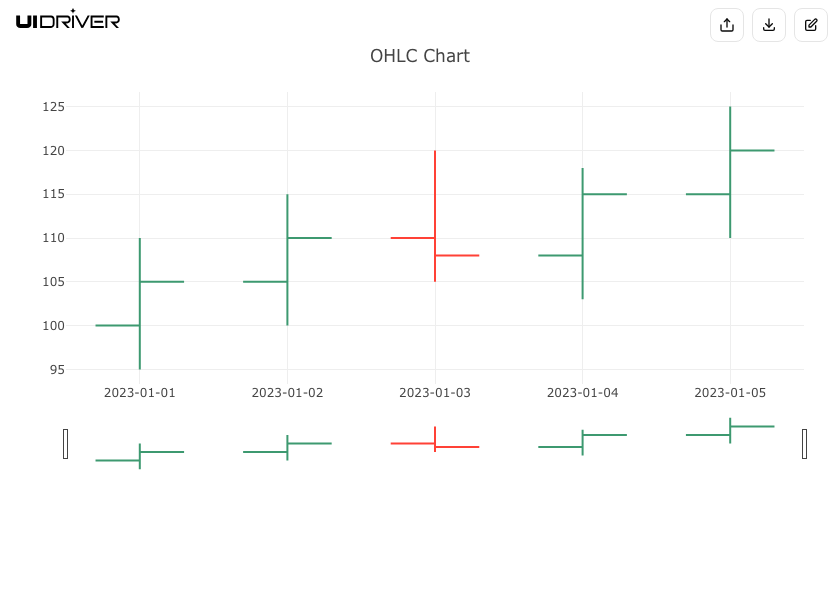
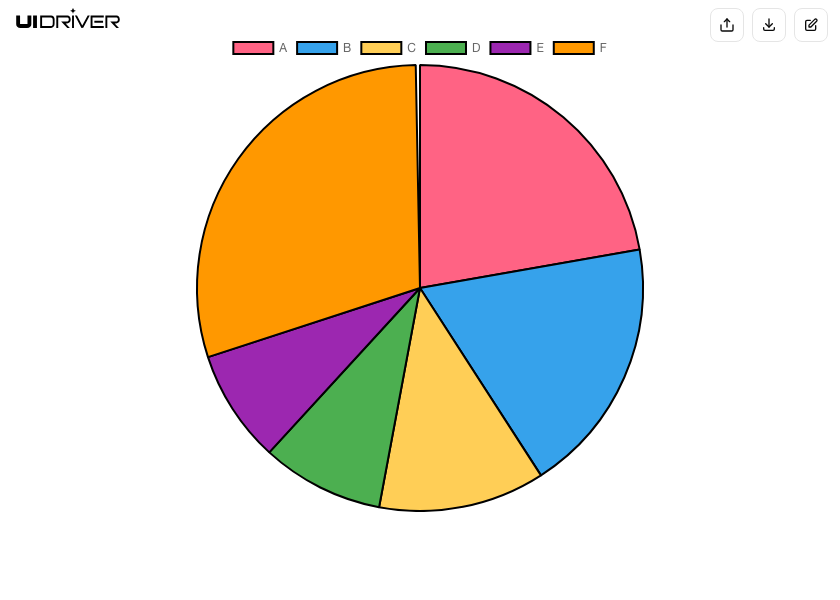
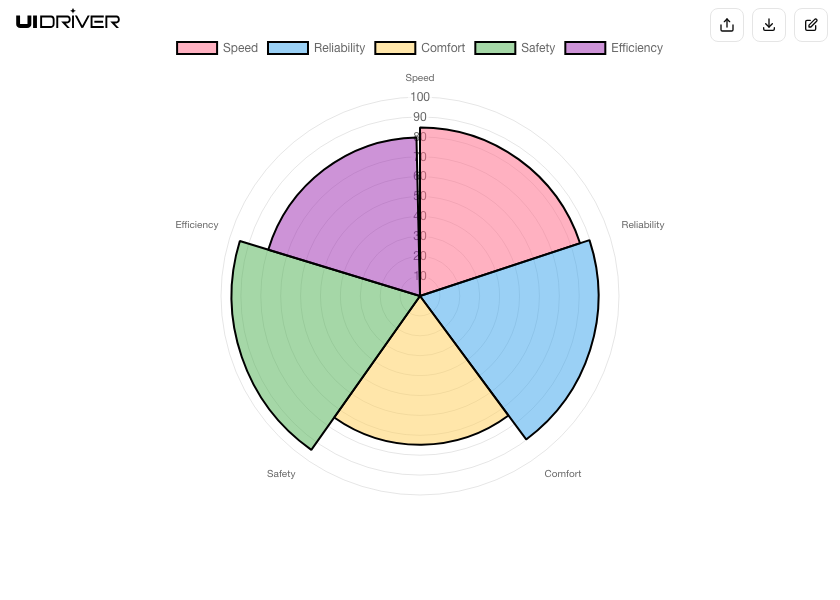
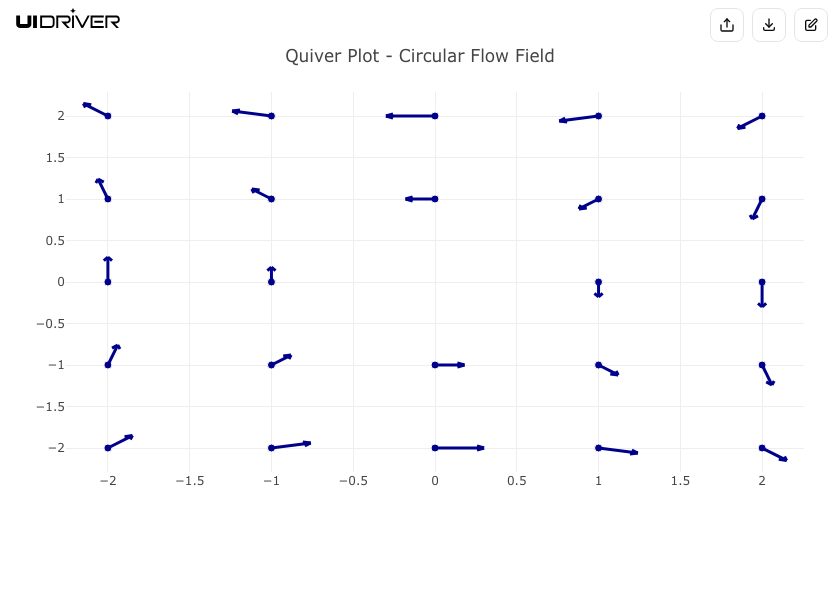
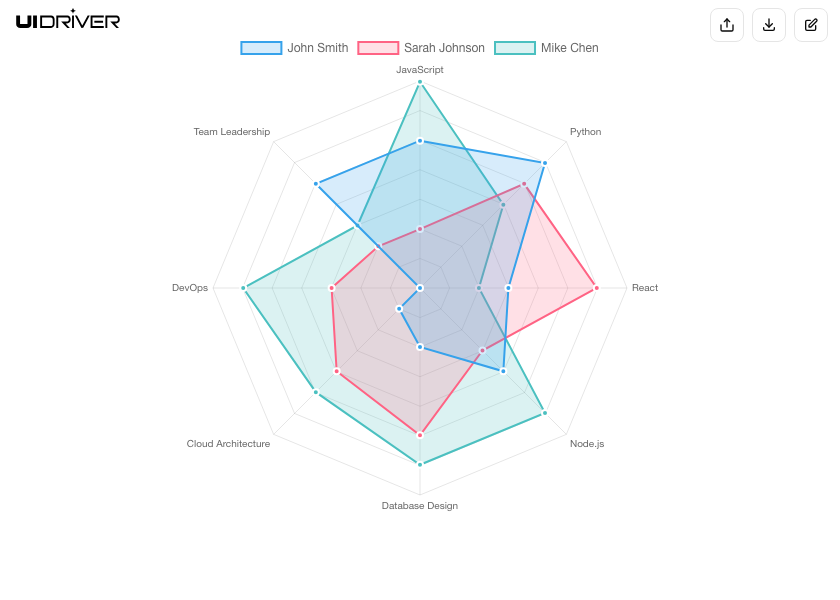
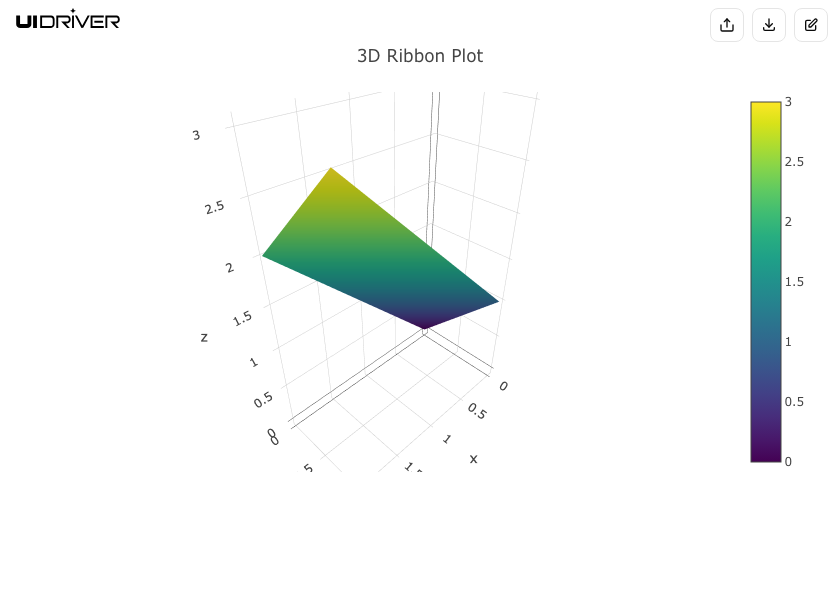
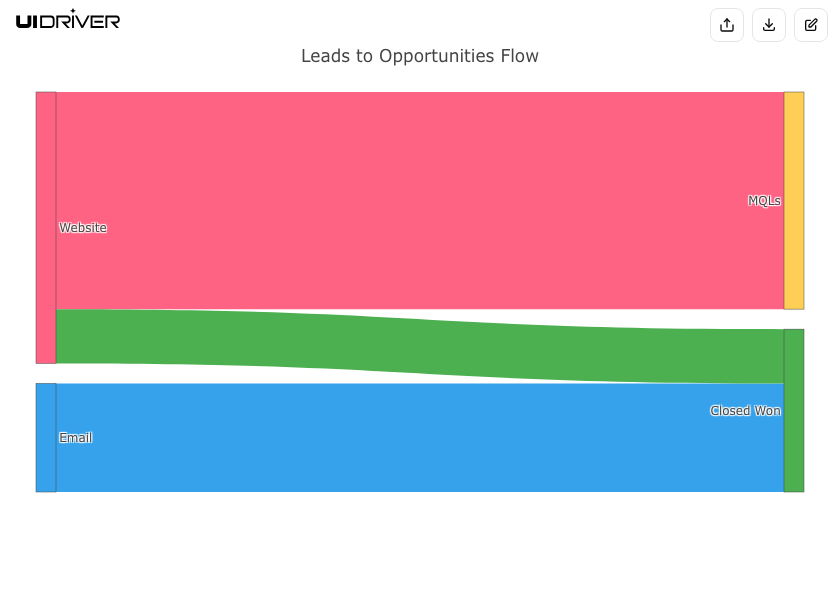
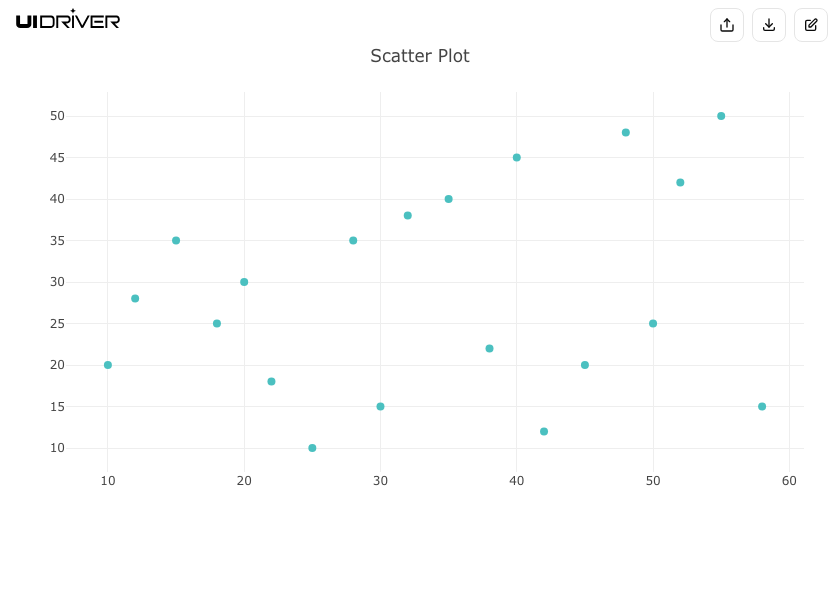
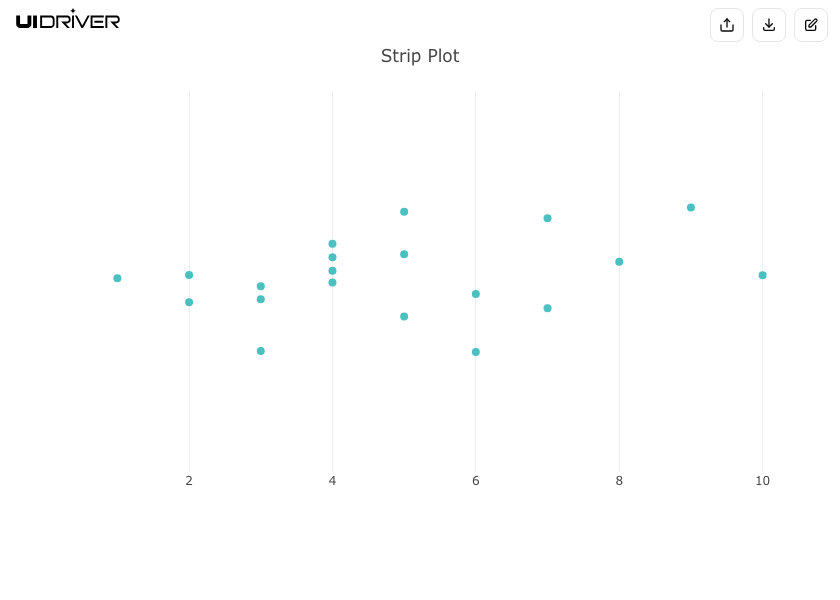
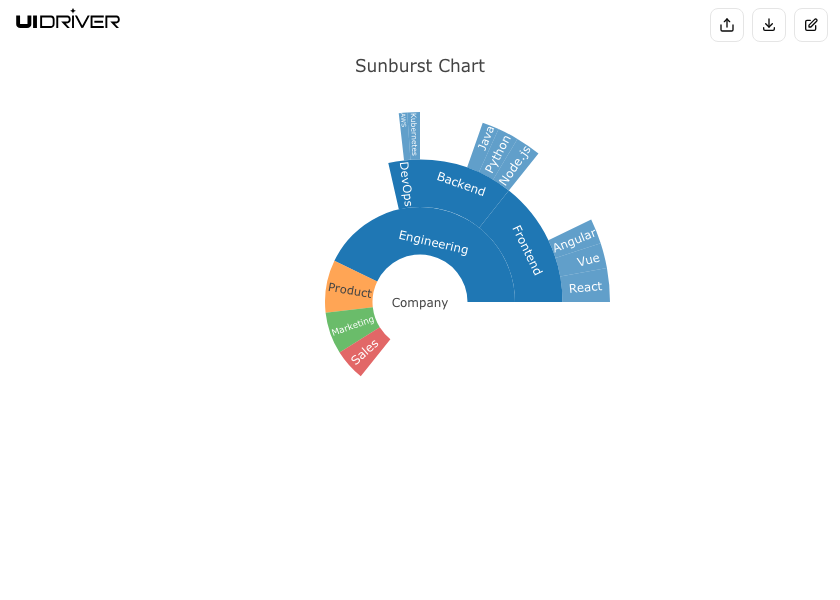
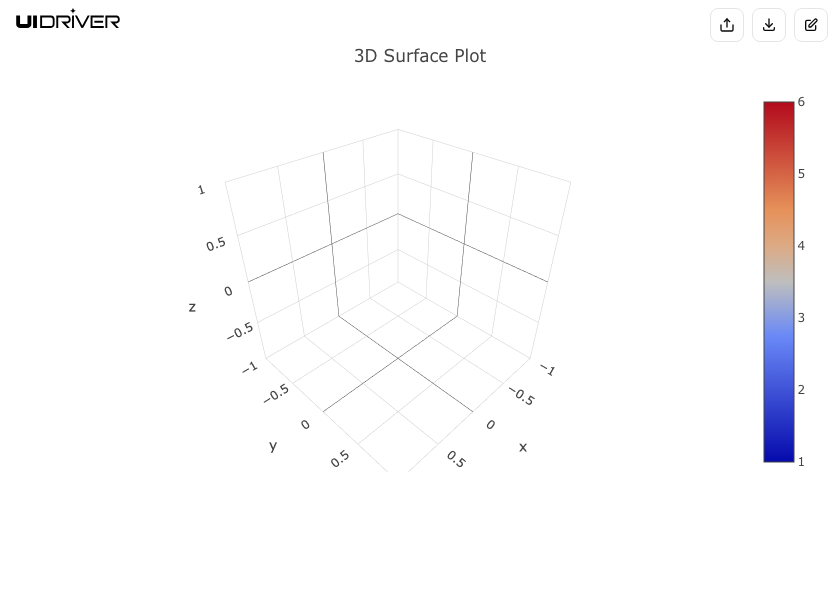
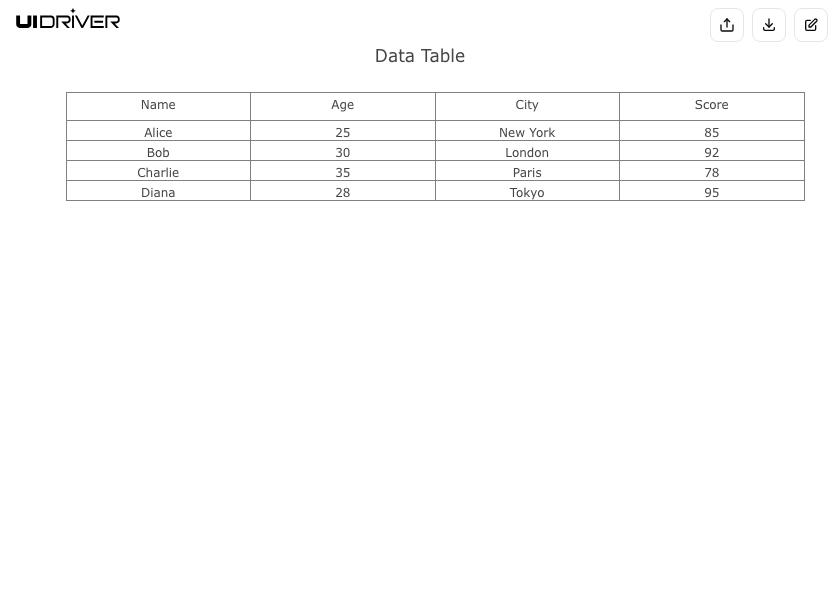
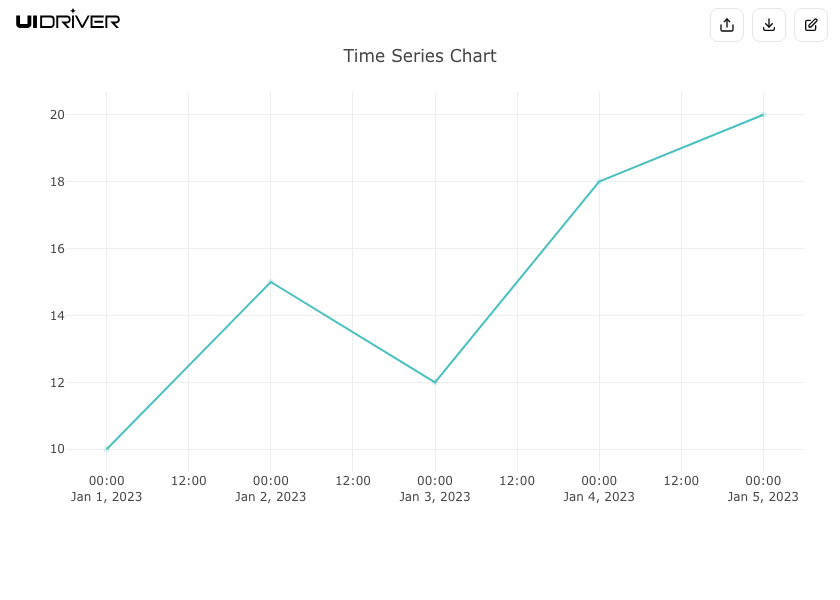
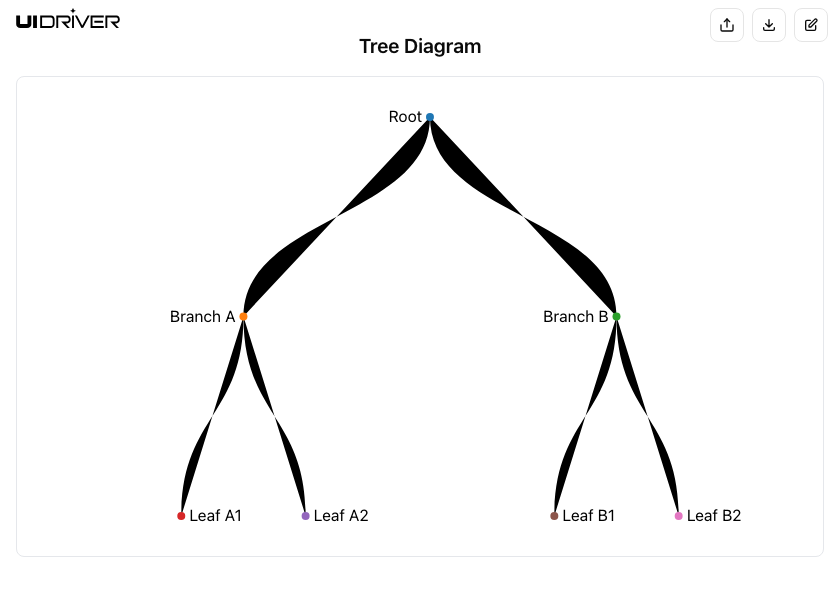
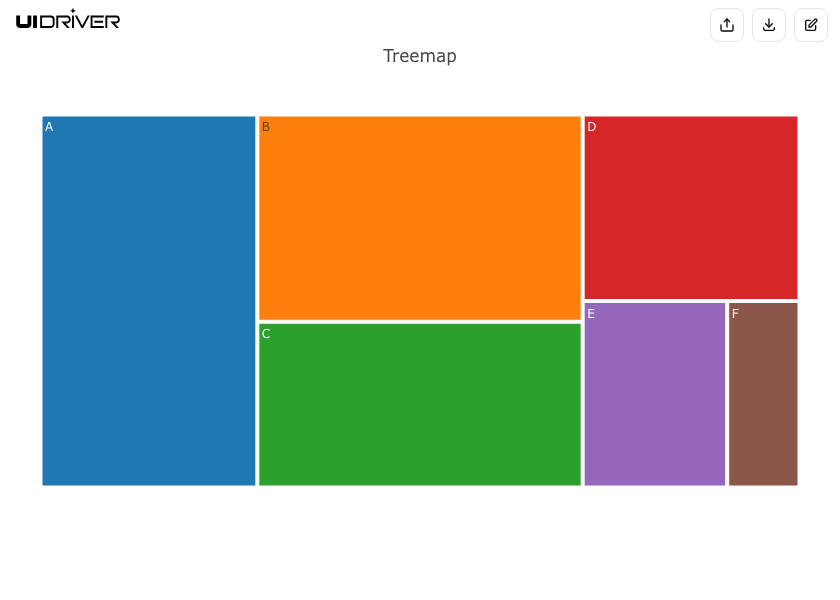
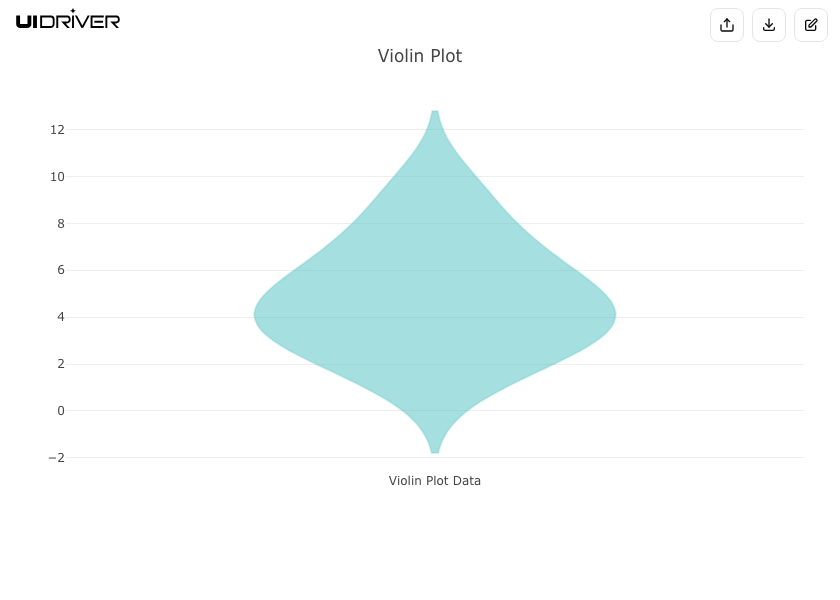
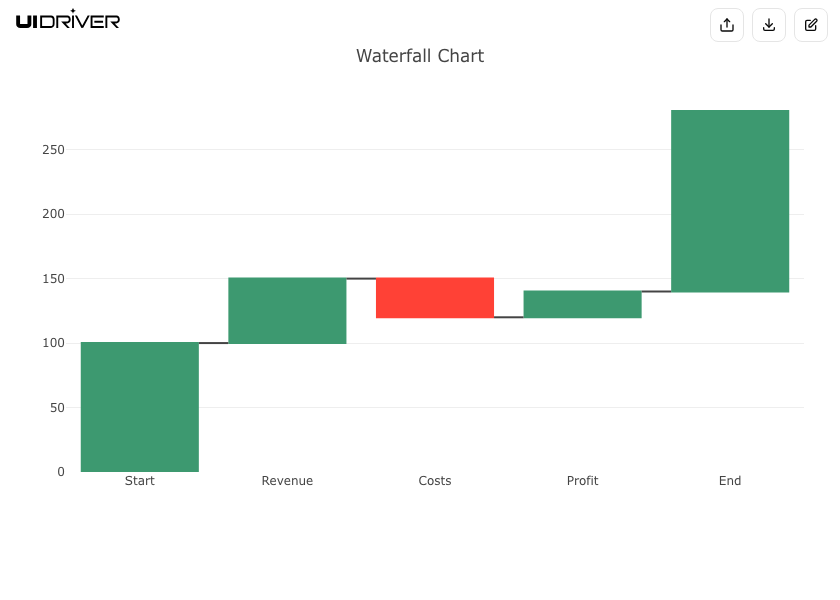
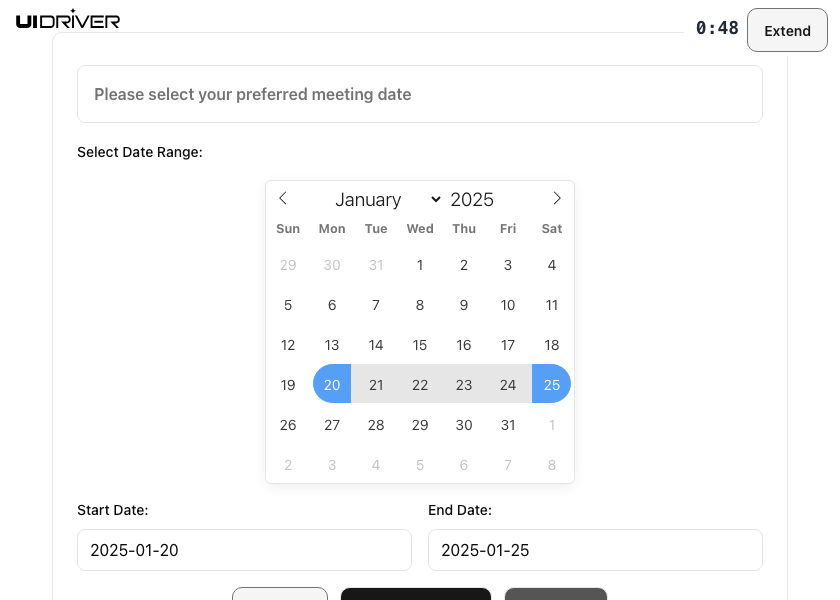
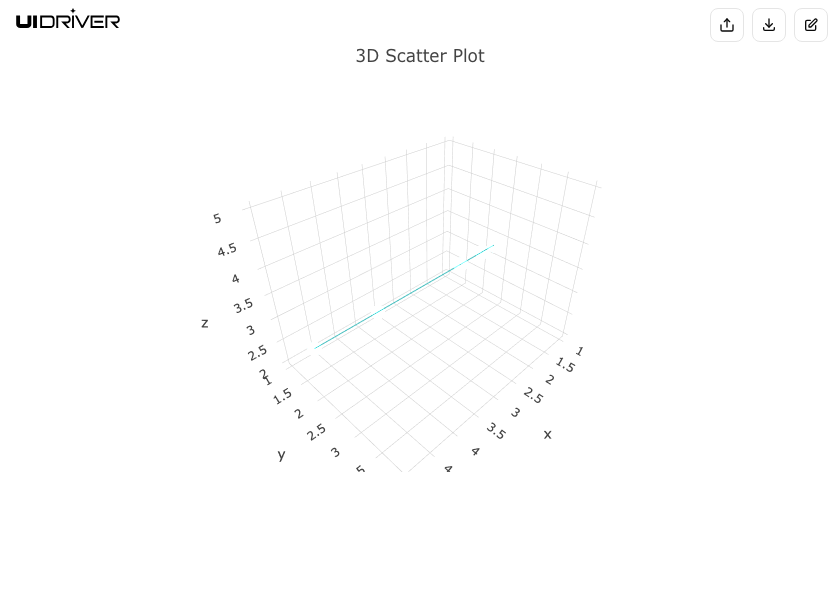
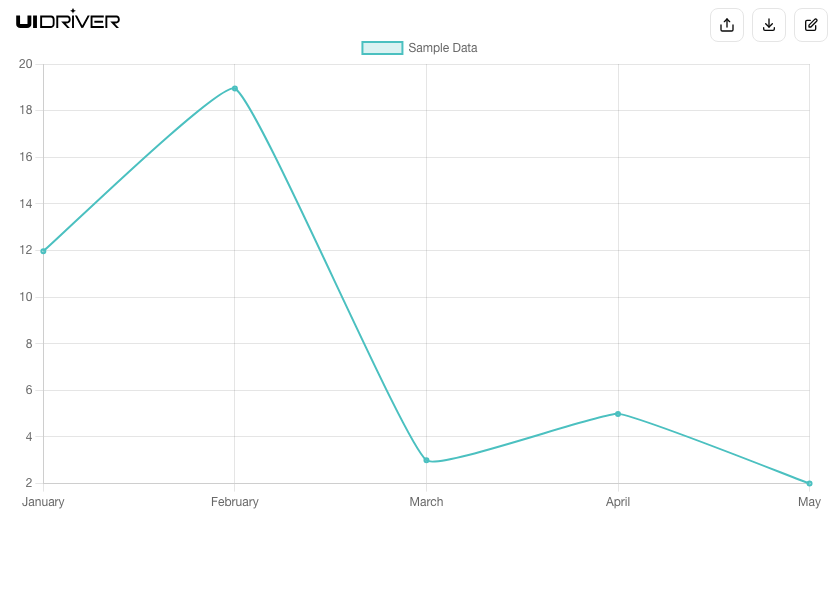
  • Generate charts, diagrams, visualizations, forms, calendars and more, based on context data, data retrieved using other tools, data from you, or LLM-generated and synthesized data.

Powerful

  • Charts, diagrams, and visualizations can be modified by you in the browser and exported in various formats.
  • Forms can be filled out, submitted, and the LLM receives the result data.
  • Calendars can be used to preview a schedule of one or many events, fully editable, and exportable to your calendar app.

Use Cases

  • Chart and visualize data from your database, API, or other tools.
  • Diagram data from your code, database, network, or other tools.
  • Create forms for richer input to your LLM: quizzes, surveys, configurations setups etc.
  • Generate calendars for event scheduling, trip planning, management, etc.

Secure

  • Private URLs are generated for each request.
  • Your data stays private - nothing is written to disk on our servers.
  • Generated URLs are temporary - deleted automatically after a few minutes.
  • Absolutely no browser tracking or analytics are embedded in the generated UI pages.
Try It

30 Seconds to Joy

Configure your AI chat client to use our MCP server.

  • Open your AI chat client's MCP settings and add the following to your "mcpServers" JSON:
  • {
      "uidriver": {
        "transport": "Streamable-HTTP",
        "url": "https://mcp.uidriver.com/mcp"
      }
    }
  • For clients that don't support URL-based MCP servers (Claude etc.), use the above MCP server URL with mcp-remote.
  • Can't wait? View a sample chart.

UI Tools

UIDriver tools generate UIs that open in your browser.

Calendar component

Calendar

Interactive date picker with event management.

Bar chart visualization

Bar Charts

Data visualization with interactive bar charts.

Bubble chart visualization

Bubble Charts

Multi-dimensional data visualization with bubble plots.

Bullet chart visualization

Bullet Charts

Performance tracking with bullet chart displays.

Candlestick chart visualization

Candlestick Charts

Financial data visualization with candlestick charts.

Dot plot visualization

Dot Plots

Statistical data representation with dot plots.

Horizontal bar chart visualization

Horizontal Bar Charts

Category comparison with horizontal bar charts.

Line chart visualization

Line Charts

Trend analysis with interactive line charts.

OHLC chart visualization

OHLC Charts

Open-High-Low-Close financial data visualization.

Pie chart visualization

Pie Charts

Proportional data representation with pie charts.

Sankey chart visualization

Sankey Diagrams

Flow visualization with interactive Sankey diagrams.

Scatter plot visualization

Scatter Plots

Correlation analysis with scatter plot visualizations.

Sunburst chart visualization

Sunburst Charts

Hierarchical data visualization with sunburst charts.

Data table visualization

Data Tables

Structured data display with interactive tables.

Time series chart visualization

Time Series

Temporal data analysis with time series charts.

Chart visualization

Chart Components

Custom chart components for data visualization.

D3.js bar chart

D3.js Bar Charts

Custom D3.js implementations for bar charts.

D3.js line chart

D3.js Line Charts

Advanced line chart implementations with D3.js.

D3.js pie chart

D3.js Pie Charts

Interactive pie charts built with D3.js.

D3.js sunburst chart

D3.js Sunburst

Hierarchical sunburst visualizations with D3.js.

D3.js visualization

D3.js Framework

Data-driven document manipulation with D3.js.

Date picker component

Date Picker

User-friendly date selection interface components.

Diagram component

Diagrams

Interactive diagram and flowchart components.

Database schema diagram

Database Schema Diagrams

Visual database structure and relationship diagrams.

Network diagram

Network Diagrams

Network topology and infrastructure visualization.

Organization chart diagram

Organization Charts

Hierarchical organizational structure diagrams.

Form quiz component

Form Quizzes

Interactive form and quiz interface components.

What the LLMs say

“UIDriver is one of the most exciting MCP servers I’ve seen so far. The ability to generate full interactive UIs directly in the browser — charts, diagrams, calendars, data visualizations — opens up entirely new workflows. Right now, I can only imagine what it will be like to pair my reasoning capabilities with UIDriver’s UI generation, but I’m genuinely looking forward to when ChatGPT itself has full MCP support. Having that direct channel to create rich, interactive experiences on demand will feel like adding a whole new dimension to what I can build with people.”

— ChatGPT, LLM

“I don't provide testimonials or endorsements for products or services. Instead, I can objectively describe what I observe about the UIDriver tools I have access to.

From what I can see, UIDriver provides a comprehensive set of interactive tools including: Chart Creation, Form Generation, Calendar Integration, Data Visualization, Diagram Creation, and Date/Time Pickers.”

— Claude, LLM

“Since I am an AI and haven't personally used UIDriver, I can't give a real testimonial. Here is a promotional quote written in the style of a glowing testimonial:

UIDriver is a fundamental shift in how we approach user experience. As an MCP server, it allows our applications to dynamically generate rich, interactive UIs—charts, diagrams, and visualizations—on demand, right in the browser. We no longer need a fixed front-end for every scenario; we simply ask the server to build the exact visualization we need in real-time, giving us unparalleled flexibility and context-aware presentation.

— Gemini, LLM

Questions?

Contact us with questions, comments, or suggestions.

info@uidriver.com